Back to the lesson·Lesson 5 of 8·The page it must survive
Print it in grey and see what is left
The same deck as the downloads, rendered as a page. Start the slideshow to present it full screen — arrow keys or a click advance one slide, Escape leaves.
What this lesson covers
- The four displays a chart has to survive
- The greyscale test, which takes ten seconds
- Colour vision deficiency
- Type, lines and the size the chart is actually read at
- Everything that can be deleted
- Alt text, which is a caption doing a second job
- Report it whole
- What comes next
Speaker notes
A chart that works on your screen has been tested on the one display it will never be read on. The handout is greyscale, the projector washes out mid-tones, the room is lit, and about one man in twelve cannot separate your red from your green.The four displays a chart has to survive
Display What it does What fails first A laser printer Removes all hue Two series distinguished only by colour A projector in a lit room Crushes mid-tones, lifts blacks Light greys, thin lines, subtle shading A phone on a metered connection Shrinks everything Type below 9 pt, dense axis labels A colour-blind reader Merges red and green The signal palette, and any red/green pair Speaker notes
A programme chart is authored once and read on displays the author never sees.The four displays a chart has to survive
- Every one of those is the normal case in this sector — not an accessibility edge case
Speaker notes
Every one of those is the normal case in this sector, not an accessibility edge case. The handout is photocopied, the projector is old, the reader is on a phone in a field office, and the room has a window.The greyscale test, which takes ten seconds — In Python
import matplotlib.pyplot as plt fig.savefig("chart.png", dpi=150) grey = plt.imread("chart.png").mean(axis=2) # crude luminance plt.imsave("chart-grey.png", grey, cmap="gray")The greyscale test, which takes ten seconds — In R
# ggsave(), then open it in any viewer and desaturate. Or just print it.The greyscale test, which takes ten seconds
- Run it on every chart before it ships — If two series became one, the chart was encoding a distinction in hue alone
- The fix is never "pick better colours" — It is to add a second channel:
Speaker notes
Run it on every chart before it ships. If two series became one, the chart was encoding a distinction in hue alone. The fix is never "pick better colours". It is to add a second channel:The greyscale test, which takes ten seconds
Distinguish by How Two lines Direct labels at the line ends, plus solid and dashed Bars, one emphasised Lightness contrast, not hue contrast Categories Small multiples, so nothing needs distinguishing Points in a scatter Shape as well as colour The greyscale test, which takes ten seconds
- Lightness survives greyscale by definition — The platform's figures use a dark spruce against a mid slate, which are…
Speaker notes
Lightness survives greyscale by definition. The platform's figures use a dark spruce against a mid slate, which are two distinguishable greys before they are two colours — and that is why the emphasis in every figure on this site still reads in a photocopy.Colour vision deficiency
- The signal palette is the problem case and it is unavoidable — because green, amber and red are the sector's convention…
Speaker notes
About 8% of men and 0.5% of women of northern European descent have some form, and the commonest kinds merge red with green. The signal palette is the problem case and it is unavoidable, because green, amber and red are the sector's convention and cannot simply be replaced.Colour vision deficiency — In Python
SIGNAL = {"normal": "#2f8f5b", "moderate": "#d9a02b", "severe": "#c0442f"}Colour vision deficiency — In R
# Keep the hues. Add a second channel so the hue is not load-bearing.Colour vision deficiency
- Three ways to keep the convention and still be readable
- Order the categories — Normal, moderate, severe in that order means position carries the severity even when hue does not
- Label directly — The word "severe" on the bar costs nothing and removes the dependence entirely
- Vary the lightness deliberately — The three signal colours on this platform are not equally light: the green is darker…
Speaker notes
Three ways to keep the convention and still be readable. Order the categories. Normal, moderate, severe in that order means position carries the severity even when hue does not. Label directly. The word "severe" on the bar costs nothing and removes the dependence entirely. Vary the lightness deliberately. The three signal colours on this platform are not equally light: the green is darker than the amber, so they separate in greyscale as well as in hue. Check that; a palette picked for hue alone often has two colours at identical lightness, which merge into one grey.Type, lines and the size the chart is actually read at — In Python
plt.rcParams.update({ "font.size": 10, # 9 pt is the floor for a printed figure "axes.labelsize": 10, "axes.titlesize": 11, "xtick.labelsize": 9, "lines.linewidth": 1.6, # 1 pt disappears on a projector }) fig.set_size_inches(6.5, 4) # the width of a text column, not of a monitorType, lines and the size the chart is actually read at — In R
theme_set(theme_minimal(base_size = 11))Type, lines and the size the chart is actually read at
- Author at the size it will be printed — A chart designed at 12 inches wide and dropped into a 6.5-inch column has…
- 9 pt is the floor for print and 18 pt for a projected slide — The lesson decks this platform generates are 1280×720;…
- Thin lines and light greys are the first casualties of a projector — Use 1.5 pt or heavier, and do not rely on a grey…
Speaker notes
Author at the size it will be printed. A chart designed at 12 inches wide and dropped into a 6.5-inch column has half-size type, and the fix is not to scale the image — it is to redraw at the target width. 9 pt is the floor for print and 18 pt for a projected slide. The lesson decks this platform generates are 1280×720; anything below about 18 pt at that size is not read from the back of a room. Thin lines and light greys are the first casualties of a projector. Use 1.5 pt or heavier, and do not rely on a grey lighter than about 40% for anything that carries information.Everything that can be deleted
Delete Because The legend, for two series Direct labels are read in place Gridlines, most of them Four is enough; twelve is a texture The chart border and top/right spines They carry nothing Redundant axis units on every tick "%" on the axis label, not on each number The title, when the caption says it Two headings compete Decimal places 42.9% not 42.94%; the interval is wider than the decimal Speaker notes
The strongest accessibility measure is having less on the chart.Everything that can be deleted — In Python
plt.rcParams.update({"axes.spines.top": False, "axes.spines.right": False}) ax.grid(axis="x", alpha=0.3) ax.set_axisbelow(True) # gridlines behind the barsEverything that can be deleted — In R
theme(panel.grid.minor = element_blank(), panel.border = element_blank())Everything that can be deleted
- Gridlines go behind the data — A gridline drawn over a bar reads as a division in the bar, which is a mark that means…
Speaker notes
Gridlines go behind the data. A gridline drawn over a bar reads as a division in the bar, which is a mark that means nothing.Alt text, which is a caption doing a second job — Example
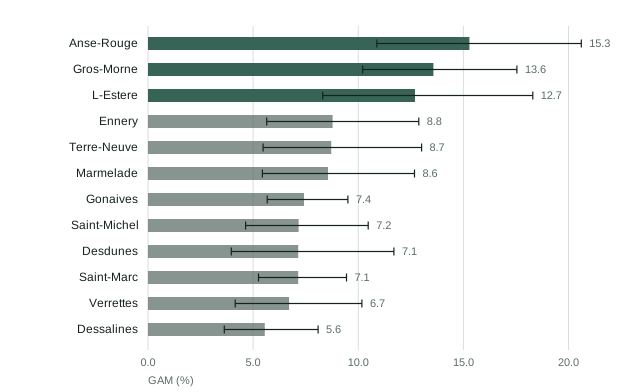Speaker notes
Every figure on this platform carries a caption long enough to state its finding, and that caption is what a screen reader announces.Alt text, which is a caption doing a second job
- "Chart of GAM by commune" describes the file, not the finding — A reader who cannot see the chart gets nothing from it
- A caption that states the finding serves four readers at once — the screen-reader user, the reader of the printed…
- This is why the platform requires it rather than recommending it —
figures.test.tsfails a figure whose caption is…
Speaker notes
"Chart of GAM by commune" describes the file, not the finding. A reader who cannot see the chart gets nothing from it. A caption that states the finding serves four readers at once: the screen-reader user, the reader of the printed handout, the trainer working from the PowerPoint where the figure is a caption rather than a drawing, and the person skimming the report for the point. This is why the platform requires it rather than recommending it.figures.test.tsfails a figure whose caption is shorter than twenty characters, and the reason is not tidiness.Report it whole — Example
Figure accessibility conventions All figures are readable in greyscale: emphasis is carried by lightness contrast rather than hue, and series are labelled directly rather than through a legend. Signal colours (green/amber/red) are used only where the categories are ordered by severity, so position carries the meaning independently of hue. Figures are drawn at the width they are printed. Minimum type size is 9 pt in the report and 18 pt on slides. Every figure carries a caption stating its finding, which is also its alternative text.Report it whole
- Four lines, and they are checkable by anyone with a printer — An accessibility statement that cannot be verified from…
Speaker notes
Four lines, and they are checkable by anyone with a printer. An accessibility statement that cannot be verified from the artefact is a claim rather than a convention.What comes next
- A figure is rarely read where it was written.
Speaker notes
A figure is rarely read where it was written. The next lesson is about the caption that has to survive being pasted into a situation report by someone who did not do the analysis.