Back to the lesson·Lesson 5 of 8·Values that cannot be true
Rules the sector already gave you
The same deck as the downloads, rendered as a page. Start the slideshow to present it full screen — arrow keys or a click advance one slide, Escape leaves.
What this lesson covers
- "That looks wrong" is not a rule
- The thresholds already exist
- Rules as data, not as if-statements
- Applying the table
- Hard bounds and soft bounds
- Rules that compare two columns
- Flag, do not delete
- The flag rate is itself an indicator
- What comes next
Speaker notes
Turn "that looks wrong" into a rule table with a source, a severity and a count. Hard bounds against physical limits, soft bounds against the sector's thresholds, and the discipline of flagging rather than deleting."That looks wrong" is not a rule
- Everyone doing this work develops an eye.
Speaker notes
Everyone doing this work develops an eye. You scroll a column, something snags, you go and look. It works, and it does not scale, does not transfer to the person who takes over from you, and cannot be defended in a review — because the answer to "why did you drop that row" is "it looked wrong". The fix is to write the rule down: a condition, a source, a severity and a count. Once it exists in that form it runs on next quarter's file, it explains itself, and the number of rows it caught becomes a line in the cleaning log.The thresholds already exist
Domain Rule Source MUAC, 6-59 months Below 80 mm or above 220 mm is not a measurement WHO / CMAM field practice Weight-for-height z Outside -5 to +5 of the reference WHO 2006 growth standards SMART anthropometry Flag z-scores more than 3 SD from the survey mean SMART plausibility report Water quantity Below 15 litres per person per day is below minimum Sphere Water collection Round trip over 30 minutes is limited, not basic, service JMP service ladders Free residual chlorine 0.2 to 2.0 mg/L at the point of consumption Sphere / WHO Coverage Doses administered above the target population needs explaining UNICEF indicator guidance Speaker notes
You are almost never inventing a limit. This sector is unusually well supplied with published, defensible cut-offs, and using them is what makes a rule a rule rather than an opinion.The thresholds already exist
- Cite the source in the rule — A threshold with a citation survives being questioned; the same number without one gets…
Speaker notes
Cite the source in the rule. A threshold with a citation survives being questioned; the same number without one gets argued about every quarter.Rules as data, not as if-statements — In Python (cont.)
RULES = [
    {
        "id": "muac-range",
        "column": "muac_mm",
        "severity": "error",
        "source": "WHO / CMAM field practice",
        "test": lambda d: d["muac_mm"].between(80, 220) | d["muac_mm"].isna(),
        "message": "MUAC outside 80-220 mm",
    },
    {
        "id": "muac-unit-error",
        "column": "muac_mm",
        "severity": "warning",
        "source": "unit check, cm entered as mm",
        "test": lambda d: ~d["muac_mm"].between(1, 40),
        "message": "MUAC looks like centimetres",
Speaker notes
Write the rules as a table the code iterates over. Two reasons, and the second is the one that matters. The first is obvious: adding a rule is adding a row. The second is that a rule table can be counted, reported and diffed — you can print how many rows each rule caught, compare against last quarter, and paste the whole thing into the cleaning log without rewriting it in prose.Rules as data, not as if-statements — In Python (cont.)
}, { "id": "age-in-scope", "column": "age_months", "severity": "warning", "source": "CMAM screening protocol, 6-59 months", "test": lambda d: d["age_months"].between(6, 59) | d["age_months"].isna(), "message": "age outside the screening window", }, ]Rules as data, not as if-statements — In R
RULES <- tibble::tribble( ~id, ~column, ~severity, ~source, ~message, "muac-range", "muac_mm", "error", "WHO / CMAM field practice", "MUAC outside 80-220 mm", "muac-unit-error", "muac_mm", "warning", "unit check, cm entered as mm", "MUAC looks like centimetres", "age-in-scope", "age_months", "warning", "CMAM screening protocol, 6-59 mo", "age outside the screening window" ) TESTS <- list( `muac-range` = function(d) dplyr::between(d$muac_mm, 80, 220) | is.na(d$muac_mm), `muac-unit-error` = function(d) !dplyr::between(d$muac_mm, 1, 40), `age-in-scope` = function(d) dplyr::between(d$age_months, 6, 59) | is.na(d$age_months) )Rules as data, not as if-statements
- Every test passes on a missing value — That is deliberate and it catches people out constantly:
NA < 80is not false,…
Speaker notes
Every test passes on a missing value. That is deliberate and it catches people out constantly:NA < 80is not false, it is unknown, and a rule that treats unknown as a violation will report your missingness twice — once as missingness and once as an implausible value. Missingness is lesson 2's problem. Keep the two separate.- Every test passes on a missing value — That is deliberate and it catches people out constantly:
Applying the table — In Python (cont.)
def apply_rules(df, rules): results = [] flags = pd.DataFrame(index=df.index) for rule in rules: ok = rule["test"](df) flags[rule["id"]] = ~ok results.append({ "rule": rule["id"], "severity": rule["severity"], "column": rule["column"], "failed": int((~ok).sum()), "share": round((~ok).mean(), 4), "source": rule["source"], }) return pd.DataFrame(results), flagsApplying the table — In Python (cont.)
report, flags = apply_rules(muac, RULES) print(report.to_string(index=False))Applying the table — In R
apply_rules <- function(df, rules, tests) { flags <- purrr::map_dfc(rules$id, function(id) { tibble::tibble(!!id := !tests[[id]](df)) }) report <- rules |> dplyr::mutate( failed = purrr::map_int(id, ~ sum(flags[[.x]], na.rm = TRUE)), share = round(failed / nrow(df), 4) ) list(report = report, flags = flags) } out <- apply_rules(muac, RULES, TESTS) out$reportApplying the table
Rule Severity Failed Share muac-range error 7 0.17% muac-unit-error warning 7 0.17% age-in-scope warning 0 0.00% Speaker notes
Seven rows fail both MUAC rules, which is the answer you want: the same seven records are out of range and look like centimetres, so they are a unit error rather than seven unrelated mistakes. Two rules agreeing is evidence about the cause; one rule firing alone would only tell you something is wrong.age-in-scopecatches nothing, and that is worth keeping too. A rule that never fires costs one line and proves the constraint holds — and the day it starts firing, it is telling you the programme changed.Hard bounds and soft bounds
- Hard bounds are physically or logically impossible. A negative household size, a MUAC of 450 mm, a discharge date…
- Soft bounds are implausible but possible. Ten litres per person per day is below the Sphere minimum, and it is also…
Speaker notes
Not every rule means the same thing, and collapsing them is how a cleaning script starts deleting real data. The WASH survey shows how easy it is to confuse the two. Twelve households report more than 60 litres per person per day, against a median in the teens. Sixty litres per person is not impossible; it is what a household with a yard connection and a garden actually uses. But in a file where a handful of enumerators recorded the household's total consumption in a per-person column, it is also exactly what that error looks like.Hard bounds and soft bounds — In Python
suspect = wash[wash["litres_per_person_day"] > 60][ ["household_id", "community", "household_size", "litres_per_person_day", "water_source"] ] suspect["implied_total"] = suspect["litres_per_person_day"] * suspect["household_size"] print(suspect)Hard bounds and soft bounds — In R
wash |>
  filter(litres_per_person_day > 60) |>
  mutate(implied_total = litres_per_person_day * household_size) |>
  select(household_id, community, household_size, litres_per_person_day,
         water_source, implied_total)
Speaker notes
Look atimplied_total. If a household of seven is recorded at 140 litres per person, the implied total is 980 litres a day carried by hand, which is not happening. The rule that resolves an ambiguous value is usually a second column, not a tighter threshold. The same trap sits in the collection time. Forty-two households report a round trip under six minutes from a source that is not on their plot. Some of those are a tap at the end of the road. Some are an enumerator who wrote hours in a minutes field. Nothing in the column distinguishes them, and the honest rule flags all forty-two for review rather than pretending to know which is which.Rules that compare two columns — In Python
CROSS_RULES = [
    {
        "id": "referral-without-measurement",
        "severity": "warning",
        "test": lambda d: ~(d["outcome"].str.startswith("referred") & d["muac_mm"].isna()),
        "message": "referred but no MUAC recorded",
    },
    {
        "id": "outcome-contradicts-muac",
        "severity": "warning",
        "test": lambda d: ~((d["muac_mm"] >= 125) & (d["oedema"] != True)
                            & (d["outcome"] != "no-action")),
        "message": "no-action expected from the measurement",
    },
]
Speaker notes
The highest-value rules are rarely about one column's range. They are about two columns that must agree.Rules that compare two columns — In R
CROSS_TESTS <- list(
  `referral-without-measurement` = function(d)
    !(startsWith(d$outcome, "referred") & is.na(d$muac_mm)),
  `outcome-contradicts-muac` = function(d)
    !(d$muac_mm >= 125 & !d$oedema & d$outcome != "no-action")
)
Speaker notes
Ten records carry a referral decision with no measurement behind it, and nine carry an outcome their own measurement contradicts. Neither is impossible — a child can be referred on clinical judgement, and a referral can be right for a reason the register does not hold. But both are worth a phone call, and neither is findable by looking at either column alone.Flag, do not delete — In Python
muac = muac.join(flags.add_prefix("flag_"))
muac["flag_any_error"] = flags[[r["id"] for r in RULES if r["severity"] == "error"]].any(axis=1)
Speaker notes
The rule adds a column. It does not remove a row.Flag, do not delete — In R
muac <- dplyr::bind_cols(muac, dplyr::rename_with(out$flags, ~ paste0("flag_", .x))) muac$flag_any_error <- dplyr::if_any(dplyr::starts_with("flag_"), identity)Flag, do not delete
- The count is still available. "4,218 screenings, 7 excluded for an implausible measurement" needs both numbers, and…
- The exclusion is reversible. A reviewer who disagrees with a rule can rerun the analysis without it, in one line.
- The flags are analysable. Which brings us to the last section.
Speaker notes
Three things this buys you that a filter does not. Apply the exclusion once, at the point of computation, and say so:Flag, do not delete — In Python
analysis = muac[~muac["flag_any_error"]] print(f"{len(muac)} screenings, {len(analysis)} analysed, " f"{muac['flag_any_error'].sum()} excluded")Flag, do not delete — In R
analysis <- muac |> filter(!flag_any_error) sprintf("%d screenings, %d analysed, %d excluded", nrow(muac), nrow(analysis), sum(muac$flag_any_error))The flag rate is itself an indicator
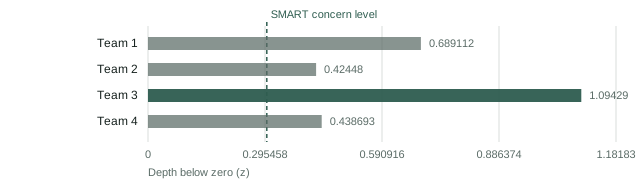
Mean weight-for-height z-score by measurement team in the SMART survey, plotted as depth below zero. Clusters were assigned to teams independently of nutrition status, so a spread of this size between teams is a measurement fault rather than a real difference between populations. Speaker notes
Once flags are columns, group them the way you group anything else — and what comes back is a statement about data collection rather than about children.The flag rate is itself an indicator — In Python
print(muac.groupby("commune")[["flag_muac_unit_error", "flag_any_error"]].mean())The flag rate is itself an indicator — In R
muac |> summarise(across(starts_with("flag_"), mean), .by = commune)The flag rate is itself an indicator
A rule that fires everywhere is a rule about the world. A rule that fires in one place is a rule about a team.
Speaker notes
If one commune, one team or one enumerator accounts for most of a flag, the finding is not in the data — it is in the supervision. That is a much more useful thing to put in a monthly report than a corrected number, because it is actionable: the team can be retrained, and next quarter's file will be better rather than merely cleaned.What comes next
- Every rule so far compares a value against a number.
Speaker notes
Every rule so far compares a value against a number. The next lesson handles the values that have to be compared against a list — the free-text site and village names that arrive in four spellings, where the authority is an administrative list and the hard part is refusing to invent a match.