Lesson 5 of 8
Unit · Values that cannot be true
Rules the sector already gave you
Turn "that looks wrong" into a rule table with a source, a severity and a count. Hard bounds against physical limits, soft bounds against the sector's thresholds, and the discipline of flagging rather than deleting.
“That looks wrong” is not a rule
Everyone doing this work develops an eye. You scroll a column, something snags, you go and look. It works, and it does not scale, does not transfer to the person who takes over from you, and cannot be defended in a review — because the answer to “why did you drop that row” is “it looked wrong”.
The fix is to write the rule down: a condition, a source, a severity and a count. Once it exists in that form it runs on next quarter’s file, it explains itself, and the number of rows it caught becomes a line in the cleaning log.
The thresholds already exist
You are almost never inventing a limit. This sector is unusually well supplied with published, defensible cut-offs, and using them is what makes a rule a rule rather than an opinion.
| Domain | Rule | Source |
|---|---|---|
| MUAC, 6-59 months | Below 80 mm or above 220 mm is not a measurement | WHO / CMAM field practice |
| Weight-for-height z | Outside -5 to +5 of the reference | WHO 2006 growth standards |
| SMART anthropometry | Flag z-scores more than 3 SD from the survey mean | SMART plausibility report |
| Water quantity | Below 15 litres per person per day is below minimum | Sphere |
| Water collection | Round trip over 30 minutes is limited, not basic, service | JMP service ladders |
| Free residual chlorine | 0.2 to 2.0 mg/L at the point of consumption | Sphere / WHO |
| Coverage | Doses administered above the target population needs explaining | UNICEF indicator guidance |
Cite the source in the rule. A threshold with a citation survives being questioned; the same number without one gets argued about every quarter.
Rules as data, not as if-statements
Write the rules as a table the code iterates over. Two reasons, and the second is the one that matters.
The first is obvious: adding a rule is adding a row. The second is that a rule table can be counted, reported and diffed — you can print how many rows each rule caught, compare against last quarter, and paste the whole thing into the cleaning log without rewriting it in prose.
RULES = [
    {
        "id": "muac-range",
        "column": "muac_mm",
        "severity": "error",
        "source": "WHO / CMAM field practice",
        "test": lambda d: d["muac_mm"].between(80, 220) | d["muac_mm"].isna(),
        "message": "MUAC outside 80-220 mm",
    },
    {
        "id": "muac-unit-error",
        "column": "muac_mm",
        "severity": "warning",
        "source": "unit check, cm entered as mm",
        "test": lambda d: ~d["muac_mm"].between(1, 40),
        "message": "MUAC looks like centimetres",
    },
    {
        "id": "age-in-scope",
        "column": "age_months",
        "severity": "warning",
        "source": "CMAM screening protocol, 6-59 months",
        "test": lambda d: d["age_months"].between(6, 59) | d["age_months"].isna(),
        "message": "age outside the screening window",
    },
]
RULES <- tibble::tribble(
~id, ~column, ~severity, ~source, ~message,
"muac-range", "muac_mm", "error", "WHO / CMAM field practice", "MUAC outside 80-220 mm",
"muac-unit-error", "muac_mm", "warning", "unit check, cm entered as mm", "MUAC looks like centimetres",
"age-in-scope", "age_months", "warning", "CMAM screening protocol, 6-59 mo", "age outside the screening window"
)
TESTS <- list(
`muac-range` = function(d) dplyr::between(d$muac_mm, 80, 220) | is.na(d$muac_mm),
`muac-unit-error` = function(d) !dplyr::between(d$muac_mm, 1, 40),
`age-in-scope` = function(d) dplyr::between(d$age_months, 6, 59) | is.na(d$age_months)
)Every test passes on a missing value. That is deliberate and it catches people
out constantly: NA < 80 is not false, it is unknown, and a rule that treats
unknown as a violation will report your missingness twice — once as missingness
and once as an implausible value. Missingness is lesson 2’s problem. Keep the two
separate.
Applying the table
def apply_rules(df, rules):
    results = []
    flags = pd.DataFrame(index=df.index)
    for rule in rules:
        ok = rule["test"](df)
        flags[rule["id"]] = ~ok
        results.append({
            "rule": rule["id"],
            "severity": rule["severity"],
            "column": rule["column"],
            "failed": int((~ok).sum()),
            "share": round((~ok).mean(), 4),
            "source": rule["source"],
        })
    return pd.DataFrame(results), flags


report, flags = apply_rules(muac, RULES)
print(report.to_string(index=False))
apply_rules <- function(df, rules, tests) {
flags <- purrr::map_dfc(rules$id, function(id) {
tibble::tibble(!!id := !tests[[id]](df))
})
report <- rules |>
dplyr::mutate(
failed = purrr::map_int(id, ~ sum(flags[[.x]], na.rm = TRUE)),
share = round(failed / nrow(df), 4)
)
list(report = report, flags = flags)
}
out <- apply_rules(muac, RULES, TESTS)
out$report| Rule | Severity | Failed | Share |
|---|---|---|---|
| muac-range | error | 7 | 0.17% |
| muac-unit-error | warning | 7 | 0.17% |
| age-in-scope | warning | 0 | 0.00% |
Seven rows fail both MUAC rules, which is the answer you want: the same seven records are out of range and look like centimetres, so they are a unit error rather than seven unrelated mistakes. Two rules agreeing is evidence about the cause; one rule firing alone would only tell you something is wrong.
age-in-scope catches nothing, and that is worth keeping too. A rule that never
fires costs one line and proves the constraint holds — and the day it starts
firing, it is telling you the programme changed.
Hard bounds and soft bounds
Not every rule means the same thing, and collapsing them is how a cleaning script starts deleting real data.
- Hard bounds are physically or logically impossible. A negative household size, a MUAC of 450 mm, a discharge date before an admission date, doses administered to more children than exist. These are always errors.
- Soft bounds are implausible but possible. Ten litres per person per day is below the Sphere minimum, and it is also a real thing that happens to real households — that is the finding, not a defect.
The WASH survey shows how easy it is to confuse the two. Twelve households report more than 60 litres per person per day, against a median in the teens. Sixty litres per person is not impossible; it is what a household with a yard connection and a garden actually uses. But in a file where a handful of enumerators recorded the household’s total consumption in a per-person column, it is also exactly what that error looks like.
suspect = wash[wash["litres_per_person_day"] > 60][
    ["household_id", "community", "household_size", "litres_per_person_day", "water_source"]
]
suspect["implied_total"] = suspect["litres_per_person_day"] * suspect["household_size"]
print(suspect)
wash |>
filter(litres_per_person_day > 60) |>
mutate(implied_total = litres_per_person_day * household_size) |>
select(household_id, community, household_size, litres_per_person_day,
water_source, implied_total)Look at implied_total. If a household of seven is recorded at 140 litres per
person, the implied total is 980 litres a day carried by hand, which is not
happening. The rule that resolves an ambiguous value is usually a second column,
not a tighter threshold.
The same trap sits in the collection time. Forty-two households report a round trip under six minutes from a source that is not on their plot. Some of those are a tap at the end of the road. Some are an enumerator who wrote hours in a minutes field. Nothing in the column distinguishes them, and the honest rule flags all forty-two for review rather than pretending to know which is which.
Rules that compare two columns
The highest-value rules are rarely about one column’s range. They are about two columns that must agree.
CROSS_RULES = [
    {
        "id": "referral-without-measurement",
        "severity": "warning",
        "test": lambda d: ~(d["outcome"].str.startswith("referred") & d["muac_mm"].isna()),
        "message": "referred but no MUAC recorded",
    },
    {
        "id": "outcome-contradicts-muac",
        "severity": "warning",
        "test": lambda d: ~((d["muac_mm"] >= 125) & (d["oedema"] != True)
                            & (d["outcome"] != "no-action")),
        "message": "no-action expected from the measurement",
    },
]
CROSS_TESTS <- list(
`referral-without-measurement` = function(d)
!(startsWith(d$outcome, "referred") & is.na(d$muac_mm)),
`outcome-contradicts-muac` = function(d)
!(d$muac_mm >= 125 & !d$oedema & d$outcome != "no-action")
)Ten records carry a referral decision with no measurement behind it, and nine carry an outcome their own measurement contradicts. Neither is impossible — a child can be referred on clinical judgement, and a referral can be right for a reason the register does not hold. But both are worth a phone call, and neither is findable by looking at either column alone.
Flag, do not delete
The rule adds a column. It does not remove a row.
muac = muac.join(flags.add_prefix("flag_"))
muac["flag_any_error"] = flags[[r["id"] for r in RULES if r["severity"] == "error"]].any(axis=1)
muac <- dplyr::bind_cols(muac, dplyr::rename_with(out$flags, ~ paste0("flag_", .x)))
muac$flag_any_error <- dplyr::if_any(dplyr::starts_with("flag_"), identity)Three things this buys you that a filter does not.
- The count is still available. “4,218 screenings, 7 excluded for an implausible measurement” needs both numbers, and a filtered table has thrown one away.
- The exclusion is reversible. A reviewer who disagrees with a rule can rerun the analysis without it, in one line.
- The flags are analysable. Which brings us to the last section.
Apply the exclusion once, at the point of computation, and say so:
analysis = muac[~muac["flag_any_error"]]
print(f"{len(muac)} screenings, {len(analysis)} analysed, "
      f"{muac['flag_any_error'].sum()} excluded")
analysis <- muac |> filter(!flag_any_error)
sprintf("%d screenings, %d analysed, %d excluded",
nrow(muac), nrow(analysis), sum(muac$flag_any_error))The flag rate is itself an indicator
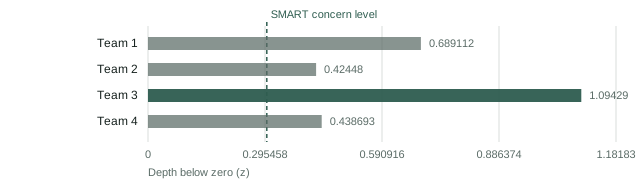
Once flags are columns, group them the way you group anything else — and what comes back is a statement about data collection rather than about children.
print(muac.groupby("commune")[["flag_muac_unit_error", "flag_any_error"]].mean())muac |>
summarise(across(starts_with("flag_"), mean), .by = commune)If one commune, one team or one enumerator accounts for most of a flag, the finding is not in the data — it is in the supervision. That is a much more useful thing to put in a monthly report than a corrected number, because it is actionable: the team can be retrained, and next quarter’s file will be better rather than merely cleaned.
A rule that fires everywhere is a rule about the world. A rule that fires in one place is a rule about a team.
What comes next
Every rule so far compares a value against a number. The next lesson handles the values that have to be compared against a list — the free-text site and village names that arrive in four spellings, where the authority is an administrative list and the hard part is refusing to invent a match.